Dx map
Sample data to try dx
cd $HOME/Desktop
mkdir test_dx
cd test_dx

# See sample scripts
ls -la $HOME/software/relax/sample_scripts/model_free
cp $HOME/software/relax/sample_scripts/model_free/map.py .

# Get data
ls -la $HOME/software/relax/test_suite/shared_data/model_free/sphere
cp $HOME/software/relax/test_suite/shared_data/model_free/sphere/*.out .
cp $HOME/software/relax/test_suite/shared_data/model_free/sphere/*.pdb .

# Run
cat map.py
relax map.py
Code to generate map
# See relax help in prompt
help(dx.map)

from pipe_control.mol_res_spin import return_spin, spin_loop

for cur_spin, mol_name, resi, resn, spin_id in spin_loop(full_info=True, return_id=True, skip_desel=True):
    file_name = "map%s" % (cur_spin_id .replace('#', '_').replace(':', '_').replace('@', '_'))
    dx.map(params=['dw', 'pA', 'kex'], map_type='Iso3D', spin_id=":1@N", inc=70, lower=None, upper=None, axis_incs=5,
        file_prefix=file_name, dir=ds.resdir, point=None, point_file='point', remap=None)
    #vp_exec:  A flag specifying whether to execute the visual program automatically at start-up.
    dx.execute(file_prefix=file_name, dir=ds.resdir, dx_exe='dx', vp_exec=True)
How to install dx
See install dx
How to use dx
Run dx, and then in the Data explorer or DE.
- Click on
Edit Visual Programs.... - Select the
map.netprogram created by relax,
Now in the Visual Program Editor or VPE.
- Select the menu entry
Execute->Execute on change.
That's it.
You now have a 3D frame, but nothing in it. Therefore the contour levels must be too low or high. From the map file, the values are in the hundreds of thousands.
Then:
- In the main program window, double click on the
Isosurface elements. - Change the values until you see surfaces. In the first the value is 500. I changed this to 500,000. Multiply all by 1000.
- In the second, 100 -> 100000.
- In the third, 20 -> 20000.
- In the last, 7 -> 7000.
This should maybe be performed by the dx.map user function, determining reasonable contour levels.
With a bit of zooming, clicking on File -> Save image in the Surface window, allowing rendering, and outputting to a large TIFF file, save current, then apply.
An example image cropped and converted to PNG in the GIMP at https://gna.org/bugs/download.php?file_id=20641.
Note that for a good resolution plot, you will need many more increments. Using the lower and upper dx.map arguments will be useful to zoom into the space.
Example images
These images is from bug 22024. Minimisation space for CR72 is catastrophic. The chi2 surface over dw and pA is bounded.
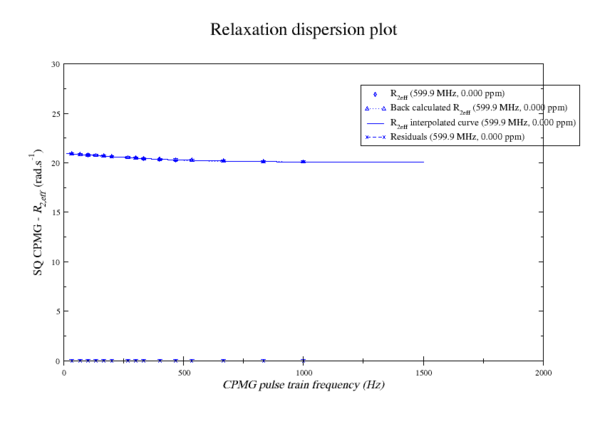 https://gna.org/bugs/index.php?22024Bug 22024: Minimisation space for CR72 is catastrophic. The chi2 surface over dw and pA is bounded. |
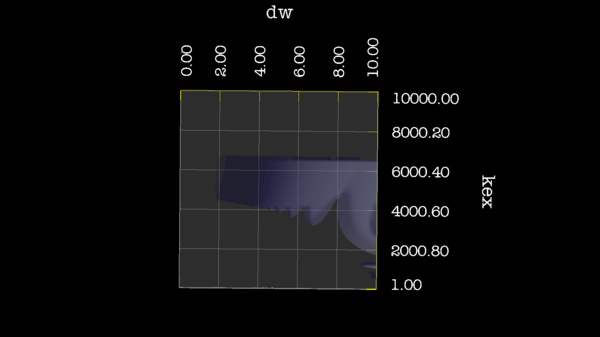 https://gna.org/bugs/index.php?22024Bug 22024: Minimisation space for CR72 is catastrophic. The chi2 surface over dw and pA is bounded. |
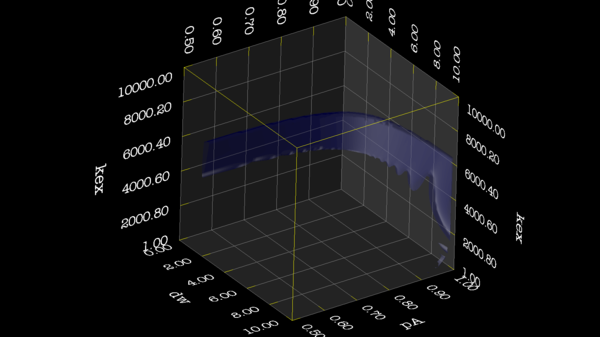 https://gna.org/bugs/index.php?22024Bug 22024: Minimisation space for CR72 is catastrophic. The chi2 surface over dw and pA is bounded. |
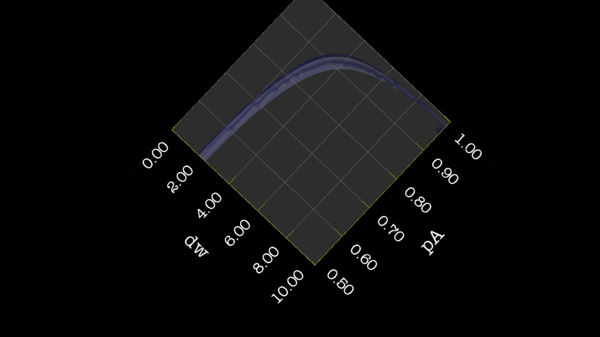 https://gna.org/bugs/index.php?22024Bug 22024: Minimisation space for CR72 is catastrophic. The chi2 surface over dw and pA is bounded. |
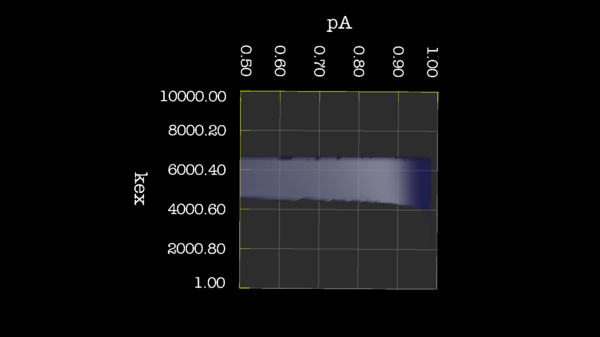 https://gna.org/bugs/index.php?22024Bug 22024: Minimisation space for CR72 is catastrophic. The chi2 surface over dw and pA is bounded. |
Code to generate map
This script will generate data that can help visualize the different models and the minimisation algorithms in relax.
Call the script cpmg_synthetic.py or similar. Remember .py ending
relax cpmg_synthetic.py
Here is the synthetic data generator code:
###############################################################################
#                                                                             #
# Copyright (C) 2013-2014 Troels E. Linnet                                    #
#                                                                             #
# This file is part of the program relax (http://www.nmr-relax.com).          #
#                                                                             #
# This program is free software: you can redistribute it and/or modify        #
# it under the terms of the GNU General Public License as published by        #
# the Free Software Foundation, either version 3 of the License, or           #
# (at your option) any later version.                                         #
#                                                                             #
# This program is distributed in the hope that it will be useful,             #
# but WITHOUT ANY WARRANTY; without even the implied warranty of              #
# MERCHANTABILITY or FITNESS FOR A PARTICULAR PURPOSE.  See the               #
# GNU General Public License for more details.                                #
#                                                                             #
# You should have received a copy of the GNU General Public License           #
# along with this program.  If not, see <http://www.gnu.org/licenses/>.       #
#                                                                             #
###############################################################################
# Script for calculating synthetics CPMG data.

# Python module imports.
from os import sep
from tempfile import mkdtemp
from math import sqrt
import sys

# relax module imports.
from auto_analyses.relax_disp import Relax_disp
from lib.io import open_write_file
from data_store import Relax_data_store; ds = Relax_data_store()
from pipe_control.mol_res_spin import return_spin, spin_loop
from specific_analyses.relax_disp.data import generate_r20_key, loop_exp_frq, loop_offset_point
from specific_analyses.relax_disp import optimisation
from status import Status; status = Status()
# The variables already defined in relax.
from specific_analyses.relax_disp.variables import EXP_TYPE_CPMG_SQ, MODEL_PARAMS
# Analytical
from specific_analyses.relax_disp.variables import MODEL_CR72, MODEL_IT99, MODEL_TSMFK01, MODEL_B14
# Analytical full
from specific_analyses.relax_disp.variables import MODEL_CR72_FULL, MODEL_B14_FULL
# NS : Numerical Solution
from specific_analyses.relax_disp.variables import MODEL_NS_CPMG_2SITE_3D, MODEL_NS_CPMG_2SITE_STAR, MODEL_NS_CPMG_2SITE_EXPANDED
# NS full
from specific_analyses.relax_disp.variables import MODEL_NS_CPMG_2SITE_3D_FULL, MODEL_NS_CPMG_2SITE_STAR_FULL

# Analysis variables.
##################################################################################
# The dispersion model to test.
if not hasattr(ds, 'data'):
    ### Take a numerical model to create the data.
    ## The "NS CPMG 2-site 3D full" is here the best, since you can define both r2a and r2b.
    #model_create = MODEL_NS_CPMG_2SITE_3D
    #model_create = MODEL_NS_CPMG_2SITE_3D_FULL
    #model_create = MODEL_NS_CPMG_2SITE_STAR
    #model_create = MODEL_NS_CPMG_2SITE_STAR_FULL
    model_create = MODEL_NS_CPMG_2SITE_EXPANDED
    #model_create = MODEL_CR72
    #model_create = MODEL_CR72_FULL
    #model_create = MODEL_B14
    #model_create = MODEL_B14_FULL

    ### The select a model to analyse with.
    ## Analytical : r2a = r2b
    model_analyse = MODEL_CR72
    #model_analyse = MODEL_IT99
    #model_analyse = MODEL_TSMFK01
    #model_analyse = MODEL_B14

    ## Analytical full : r2a != r2b
    #model_analyse = MODEL_CR72_FULL
    #model_analyse = MODEL_B14_FULL
    ## NS : r2a = r2b
    #model_analyse = MODEL_NS_CPMG_2SITE_3D
    #model_analyse = MODEL_NS_CPMG_2SITE_STAR
    #model_analyse = MODEL_NS_CPMG_2SITE_EXPANDED
    ## NS full : r2a = r2b
    #model_analyse = MODEL_NS_CPMG_2SITE_3D_FULL
    #model_analyse = MODEL_NS_CPMG_2SITE_STAR_FULL

    ## Experiments
    # Exp 1
    sfrq_1 = 599.8908617*1E6
    r20_key_1 = generate_r20_key(exp_type=EXP_TYPE_CPMG_SQ, frq=sfrq_1)
    time_T2_1 = 0.06
    ncycs_1 = [28, 4, 32, 60, 2, 10, 16, 8, 20, 50, 18, 40, 6, 12, 24]
    # Here you define the direct R2eff errors (rad/s), as being added or subtracted for the created R2eff point in the corresponding ncyc cpmg frequence.
    #r2eff_errs_1 = [0.05, -0.05, 0.05, -0.05, 0.05, -0.05, 0.05, -0.05, 0.05, -0.05, 0.05, -0.05, 0.05, -0.05, 0.05]
    r2eff_errs_1 = [0.0] * len(ncycs_1)
    exp_1 = [sfrq_1, time_T2_1, ncycs_1, r2eff_errs_1]

    sfrq_2 = 499.8908617*1E6
    r20_key_2 = generate_r20_key(exp_type=EXP_TYPE_CPMG_SQ, frq=sfrq_2)
    time_T2_2 = 0.04
    ncycs_2 = [20, 16, 10, 36, 2, 12, 4, 22, 18, 40, 14, 26, 8, 32, 24, 6, 28 ]
    # Here you define the direct R2eff errors (rad/s), as being added or subtracted for the created R2eff point in the corresponding ncyc cpmg frequence.
    #r2eff_errs_2 = [0.05, -0.05, 0.05, -0.05, 0.05, -0.05, 0.05, -0.05, 0.05, -0.05, 0.05, -0.05, 0.05, -0.05, 0.05, -0.05, 0.05]
    r2eff_errs_2 = [0.0] * len(ncycs_2)
    exp_2 = [sfrq_2, time_T2_2, ncycs_2, r2eff_errs_2]

    # Collect all exps
    exps = [exp_1, exp_2]
    #exps = [exp_1]

    # Add more spins here.
    spins = [
            ['Ala', 1, 'N', {'r2': {r20_key_1: 25.0, r20_key_2: 24.0}, 'r2a': {r20_key_1: 25.0, r20_key_2: 24.0}, 'r2b': {r20_key_1: 25.0, r20_key_2: 24.0}, 'kex': 2200.0, 'pA': 0.993, 'dw': 0.5} ]
            #['Ala', 2, 'N', {'r2': {r20_key_1: 15.0, r20_key_2: 14.0}, 'r2a': {r20_key_1: 15.0, r20_key_2: 14.0}, 'r2b': {r20_key_1: 15.0, r20_key_2: 14.0}, 'kex': 2200.0, 'pA': 0.993, 'dw': 1.5} ]
            ]

    # Collect the eksperiment to simulate.
    ds.data = [model_create, model_analyse, spins, exps]

# Setup variables to be used
##################################################################################
# The tmp directory.
if not hasattr(ds, 'tmpdir'):
    ds.tmpdir = None

# The results directory.
if not hasattr(ds, 'resdir'):
    ds.resdir = None

# Do set_grid_r20_from_min_r2eff.
if not hasattr(ds, 'set_grid_r20_from_min_r2eff'):
    ds.set_grid_r20_from_min_r2eff = True

# Remove insignificant level.
if not hasattr(ds, 'insignificance'):
    ds.insignificance = 0.0

# The grid search size (the number of increments per dimension). "None" will set default values.
if not hasattr(ds, 'GRID_INC'):
    #ds.GRID_INC = None
    ds.GRID_INC = 21

# The do clustering.
if not hasattr(ds, 'do_cluster'):
    ds.do_cluster = False

# The function tolerance.  This is used to terminate minimisation once the function value between iterations is less than the tolerance.
# The default value is 1e-25.
if not hasattr(ds, 'set_func_tol'):
    ds.set_func_tol = 1e-25

# The maximum number of iterations.
# The default value is 1e7.
if not hasattr(ds, 'set_max_iter'):
    ds.set_max_iter = 10000000

# The verbosity level.
if not hasattr(ds, 'verbosity'):
    ds.verbosity = 1

# The rel_change WARNING level.
if not hasattr(ds, 'rel_change'):
    ds.rel_change = 0.05

# The plot_curves.
if not hasattr(ds, 'plot_curves'):
    ds.plot_curves = False

# The conversion for ShereKhan at http://sherekhan.bionmr.org/.
if not hasattr(ds, 'sherekhan_input'):
    ds.sherekhan_input = False

# The set r2eff err, for defining the error on the graphs and in the fitting weight.
# We set the error to be the same for all ncyc eksperiments.
if not hasattr(ds, 'r2eff_err'):
    ds.r2eff_err = 0.1

# The print result info.
if not hasattr(ds, 'print_res'):
    ds.print_res = True

# Make a dx map to be opened om OpenDX.
# To map the hypersurface of chi2, when altering kex, dw and pA.
if not hasattr(ds, 'opendx'):
    #ds.opendx = False
    ds.opendx = True

# Which parameters to map on chi2 surface.
if not hasattr(ds, 'dx_params'):
    ds.dx_params = ['dw', 'pA', 'kex']

# How many increements to map for each of the parameters.
# Above 20 is good. 70 - 100 is a quite good resolution.
# 4 is for speed tests.
if not hasattr(ds, 'dx_inc'):
    #ds.dx_inc = 70
    ds.dx_inc = 4

# If bounds set to None, uses the normal Grid search bounds.
if not hasattr(ds, 'dx_lower_bounds'):
    ds.dx_lower_bounds = None
    #ds.dx_lower_bounds = [0.0, 0.5, 1.0 ]

# If bounds set to None, uses the normal Grid search bounds.
if not hasattr(ds, 'dx_upper_bounds'):
    #ds.dx_upper_bounds = None
    ds.dx_upper_bounds = [10.0, 1.0, 3000.0]

# If dx_chi_surface is None, it will find Innermost, Inner, Middle and Outer Isosurface
# at 10, 20, 50 and 90 percentile of all chi2 values.
if not hasattr(ds, 'dx_chi_surface'):
    ds.dx_chi_surface = None
    #ds.dx_chi_surface = [1000.0, 20000.0, 30000., 30000.00]

##################################################################################

# Define repeating functions.
##################################################################################
# Define function to store grid results.
def save_res(res_spins):
    res_list = []
    for res_name, res_num, spin_name, params in res_spins:
        cur_spin_id = ":%i@%s"%(res_num, spin_name)
        cur_spin = return_spin(cur_spin_id)

        # Save all the paramers to loop throgh later.
        ds.model_analyse_params = cur_spin.params

        par_dic = {}
        # Now read the parameters.
        for mo_param in cur_spin.params:
            par_dic.update({mo_param : getattr(cur_spin, mo_param) })

        # Append result.
        res_list.append([res_name, res_num, spin_name, par_dic])

    return res_list

# Define function print relative change
def print_res(cur_spins=None, grid_params=None, min_params=None, clust_params=None, dx_params=[]):
    # Define list to hold data.
    dx_set_val = list(range(len(dx_params)))
    dx_clust_val = list(range(len(dx_params)))

    # Compare results.
    if ds.print_res:
        print("\n########################")
        print("Generated data with MODEL:%s"%(model_create))
        print("Analysing with MODEL:%s."%(model_analyse))
        print("########################\n")

    for i in range(len(cur_spins)):
        res_name, res_num, spin_name, params = cur_spins[i]
        cur_spin_id = ":%i@%s"%(res_num, spin_name)
        cur_spin = return_spin(cur_spin_id)

        # Now read the parameters.
        if ds.print_res:
            print("For spin: '%s'"%cur_spin_id)
        for mo_param in cur_spin.params:
            # The R2 is a dictionary, depending on spectrometer frequency.
            if isinstance(getattr(cur_spin, mo_param), dict):
                grid_r2 = grid_params[mo_param]
                min_r2 = min_params[mo_param]
                clust_r2 = clust_params[mo_param]
                set_r2 = params[mo_param]
                for key, val in min_r2.items():
                    grid_r2_frq = grid_r2[key]
                    min_r2_frq = min_r2[key]
                    clust_r2_frq = min_r2[key]
                    set_r2_frq = set_r2[key]
                    frq = float(key.split(EXP_TYPE_CPMG_SQ+' - ')[-1].split('MHz')[0])
                    rel_change = sqrt( (clust_r2_frq - set_r2_frq)**2/(clust_r2_frq)**2 )
                    if ds.print_res:
                        print("%s %s %s %s %.1f GRID=%.3f MIN=%.3f CLUST=%.3f SET=%.3f RELC=%.3f"%(cur_spin.model, res_name, cur_spin_id, mo_param, frq, grid_r2_frq, min_r2_frq, clust_r2_frq, set_r2_frq, rel_change) )
                    if rel_change > ds.rel_change:
                        if ds.print_res:
                            print("###################################")
                            print("WARNING: %s Have relative change above %.2f, and is %.4f."%(key, ds.rel_change, rel_change))
                            print("###################################\n")
            else:
                grid_val = grid_params[mo_param]
                min_val = min_params[mo_param]
                clust_val = clust_params[mo_param]
                set_val = params[mo_param]
                rel_change = sqrt( (clust_val - set_val)**2/(clust_val)**2 )
                if ds.print_res:
                    print("%s %s %s %s GRID=%.3f MIN=%.3f CLUST=%.3f SET=%.3f RELC=%.3f"%(cur_spin.model, res_name, cur_spin_id, mo_param, grid_val, min_val, clust_val, set_val, rel_change) )
                if rel_change > ds.rel_change:
                    if ds.print_res:
                        print("###################################")
                        print("WARNING: %s Have relative change above %.2f, and is %.4f."%(mo_param, ds.rel_change, rel_change))
                        print("###################################\n")

                # Store to dx map.
                if mo_param in dx_params:
                    dx_set_val[ds.dx_params.index(mo_param)] = set_val
                    dx_clust_val[ds.dx_params.index(mo_param)] = clust_val

    return dx_set_val, dx_clust_val

# Now starting
##################################################################################
# Set up the data pipe.
##################################################################################

# Extract the models
model_create = ds.data[0]
model_analyse = ds.data[1]

# Create the data pipe.
ds.pipe_name = 'base pipe'
ds.pipe_type = 'relax_disp'
ds.pipe_bundle = 'relax_disp'
ds.pipe_name_r2eff = "%s_%s_R2eff"%(model_create, ds.pipe_name )
pipe.create(pipe_name=ds.pipe_name , pipe_type=ds.pipe_type, bundle = ds.pipe_bundle)

# Generate the sequence.
cur_spins = ds.data[2]
for res_name, res_num, spin_name, params in cur_spins:
    spin.create(res_name=res_name, res_num=res_num, spin_name=spin_name)

# Set isotope
spin.isotope('15N', spin_id='@N')

# Extract experiment settings.
exps = ds.data[3]

# Now loop over the experiments, to set the variables in relax.
exp_ids = []
for exp in exps:
    sfrq, time_T2, ncycs, r2eff_errs = exp
    exp_id = 'CPMG_%3.1f' % (sfrq/1E6)
    exp_ids.append(exp_id)

    ids = []
    for ncyc in ncycs:
        nu_cpmg = ncyc / time_T2
        cur_id = '%s_%.1f' % (exp_id, nu_cpmg)
        ids.append(cur_id)

        # Set the spectrometer frequency.
        spectrometer.frequency(id=cur_id, frq=sfrq)

        # Set the experiment type.
        relax_disp.exp_type(spectrum_id=cur_id, exp_type=EXP_TYPE_CPMG_SQ)

        # Set the relaxation dispersion CPMG constant time delay T (in s).
        relax_disp.relax_time(spectrum_id=cur_id, time=time_T2)

        # Set the relaxation dispersion CPMG frequencies.
        relax_disp.cpmg_setup(spectrum_id=cur_id, cpmg_frq=nu_cpmg)

print("\n\nThe experiment IDs are %s." % ids)

## Now prepare to calculate the synthetic R2eff values.
pipe.copy(pipe_from=ds.pipe_name , pipe_to=ds.pipe_name_r2eff, bundle_to = ds.pipe_bundle)
pipe.switch(pipe_name=ds.pipe_name_r2eff)

# Then select the model to create data.
relax_disp.select_model(model=model_create)

# First loop over the defined spins and set the model parameters.
for i in range(len(cur_spins)):
    res_name, res_num, spin_name, params = cur_spins[i]
    cur_spin_id = ":%i@%s"%(res_num, spin_name)
    cur_spin = return_spin(cur_spin_id)

    if ds.print_res:
        print("For spin: '%s'"%cur_spin_id)
    for mo_param in cur_spin.params:
        # The R2 is a dictionary, depending on spectrometer frequency.
        if isinstance(getattr(cur_spin, mo_param), dict):
            set_r2 = params[mo_param]

            for key, val in set_r2.items():
                # Update value to float
                set_r2.update({ key : float(val) })
                print(cur_spin.model, res_name, cur_spin_id, mo_param, key, float(val))
            # Set it back
            setattr(cur_spin, mo_param, set_r2)
        else:
            before = getattr(cur_spin, mo_param)
            setattr(cur_spin, mo_param, float(params[mo_param]))
            after = getattr(cur_spin, mo_param)
            print(cur_spin.model, res_name, cur_spin_id, mo_param, before)

## Now doing the back calculation of R2eff values.
# First loop over the frequencies.
for exp_type, frq, ei, mi in loop_exp_frq(return_indices=True):
    exp_id = exp_ids[mi]
    exp = exps[mi]
    sfrq, time_T2, ncycs, r2eff_errs = exp

    # Then loop over the spins.
    for res_name, res_num, spin_name, params in cur_spins:
        cur_spin_id = ":%i@%s"%(res_num, spin_name)
        cur_spin = return_spin(cur_spin_id)

        ## First do a fake R2eff structure.
        # Define file name
        file_name = "%s%s.txt" % (exp_id, cur_spin_id .replace('#', '_').replace(':', '_').replace('@', '_'))
        file = open_write_file(file_name=file_name, dir=ds.tmpdir, force=True)

        # Then loop over the points, make a fake R2eff value.
        for offset, point, oi, di in loop_offset_point(exp_type=EXP_TYPE_CPMG_SQ, frq=frq, return_indices=True):
            string = "%.15f 1.0 %.3f\n"%(point, ds.r2eff_err)
            file.write(string)

        # Close file.
        file.close()

        # Read in the R2eff file to create the structure.
        # This is a trick, or else relax complains.
        relax_disp.r2eff_read_spin(id=exp_id, spin_id=cur_spin_id, file=file_name, dir=ds.tmpdir, disp_point_col=1, data_col=2, error_col=3)

        ### Now back calculate values from parameters, and stuff R2eff it back.
        print("Generating data with MODEL:%s, for spin id:%s"%(model_create, cur_spin_id))
        r2effs = optimisation.back_calc_r2eff(spin=cur_spin, spin_id=cur_spin_id)

        file = open_write_file(file_name=file_name, dir=ds.resdir, force=True)
        ## Loop over the R2eff structure
        # Loop over the points.
        for offset, point, oi, di in loop_offset_point(exp_type=EXP_TYPE_CPMG_SQ, frq=frq, return_indices=True):
            # Extract the Calculated R2eff.
            r2eff = r2effs[ei][0][mi][oi][di]

            # Find the defined error setup.
            set_r2eff_err = r2eff_errs[di]

            # Add the defined error to the calculated error.
            r2eff_w_err = r2eff + set_r2eff_err

            string = "%.15f %.15f %.3f %.15f\n"%(point, r2eff_w_err, ds.r2eff_err, r2eff)
            file.write(string)

        # Close file.
        file.close()

        # Read in the R2eff file to put into spin structure.
        relax_disp.r2eff_read_spin(id=exp_id, spin_id=cur_spin_id, file=file_name, dir=ds.resdir, disp_point_col=1, data_col=2, error_col=3)

### Now do fitting.
# Change pipe.
ds.pipe_name_MODEL = "%s_%s"%(ds.pipe_name , model_analyse)
pipe.copy(pipe_from=ds.pipe_name , pipe_to=ds.pipe_name_MODEL, bundle_to = ds.pipe_bundle)
pipe.switch(pipe_name=ds.pipe_name_MODEL)

# Copy R2eff, but not the original parameters
value.copy(pipe_from=ds.pipe_name_r2eff, pipe_to=ds.pipe_name_MODEL, param='r2eff')

# Then select model.
relax_disp.select_model(model=model_analyse)

print("Analysing with MODEL:%s."%(model_analyse))

# Remove insignificant
relax_disp.insignificance(level=ds.insignificance)

# Perform Grid Search.
if ds.GRID_INC:
    # Set the R20 parameters in the default grid search using the minimum R2eff value.
    # This speeds it up considerably.
    if ds.set_grid_r20_from_min_r2eff:
        relax_disp.set_grid_r20_from_min_r2eff(force=False)

    # Then do grid search.
    grid_search(lower=None, upper=None, inc=ds.GRID_INC, constraints=True, verbosity=ds.verbosity)

# If no Grid search, set the default values.
else:
    for param in MODEL_PARAMS[model_analyse]:
        value.set(param=param, index=None)
        # Do a grid search, which will store the chi2 value.
    #grid_search(lower=None, upper=None, inc=10, constraints=True, verbosity=ds.verbosity)

# Save result.
ds.grid_results = save_res(cur_spins)

## Now do minimisation.
minimise(min_algor='simplex', func_tol=ds.set_func_tol, max_iter=ds.set_max_iter, constraints=True, scaling=True, verbosity=ds.verbosity)

# Save results
ds.min_results = save_res(cur_spins)

# Now do clustering
if ds.do_cluster:
    # Change pipe.
    ds.pipe_name_MODEL_CLUSTER = "%s_%s_CLUSTER"%(ds.pipe_name , model_create)
    pipe.copy(pipe_from=ds.pipe_name , pipe_to=ds.pipe_name_MODEL_CLUSTER)
    pipe.switch(pipe_name=ds.pipe_name_MODEL_CLUSTER)

    # Copy R2eff, but not the original parameters
    value.copy(pipe_from=ds.pipe_name_r2eff, pipe_to=ds.pipe_name_MODEL_CLUSTER, param='r2eff')

    # Then select model.
    relax_disp.select_model(model=model_create)

    # Then cluster
    relax_disp.cluster('model_cluster', ":1-100")

    # Copy the parameters from before.
    relax_disp.parameter_copy(pipe_from=ds.pipe_name_MODEL, pipe_to=ds.pipe_name_MODEL_CLUSTER)

    # Now minimise.
    minimise(min_algor='simplex', func_tol=ds.set_func_tol, max_iter=ds.set_max_iter, constraints=True, scaling=True, verbosity=ds.verbosity)

    # Save results
    ds.clust_results = save_res(cur_spins)
else:
    ds.clust_results = ds.min_results

# Plot curves.
if ds.plot_curves:
    relax_disp.plot_disp_curves(dir=ds.resdir, force=True)

# The conversion for ShereKhan at http://sherekhan.bionmr.org/.
if ds.sherekhan_input:
    relax_disp.cluster('sherekhan', ":1-100")
    print(cdp.clustering)
    relax_disp.sherekhan_input(force=True, spin_id=None, dir=ds.resdir)

# Looping over data, to collect the results.
# Define which dx_params to collect for.
ds.dx_set_val, ds.dx_clust_val = print_res(cur_spins=cur_spins, grid_params=ds.grid_results[i][3], min_params=ds.min_results[i][3], clust_params=ds.clust_results[i][3], dx_params=ds.dx_params)

## Do a dx map.
# To map the hypersurface of chi2, when altering kex, dw and pA.
if ds.opendx:
    # First switch pipe, since dx.map will go through parameters and end up a "bad" place. :-)
    ds.pipe_name_MODEL_MAP = "%s_%s_map"%(ds.pipe_name, model_analyse)
    pipe.copy(pipe_from=ds.pipe_name , pipe_to=ds.pipe_name_MODEL_MAP, bundle_to = ds.pipe_bundle)
    pipe.switch(pipe_name=ds.pipe_name_MODEL_MAP)

    # Copy R2eff, but not the original parameters
    value.copy(pipe_from=ds.pipe_name_r2eff, pipe_to=ds.pipe_name_MODEL_MAP, param='r2eff')

    # Then select model.
    relax_disp.select_model(model=model_analyse)

    # First loop over the defined spins and set the model parameters which is not in the dx.dx_params.
    for i in range(len(cur_spins)):
        res_name, res_num, spin_name, params = cur_spins[i]
        cur_spin_id = ":%i@%s"%(res_num, spin_name)
        cur_spin = return_spin(cur_spin_id)

        for mo_param in cur_spin.params:
            # The R2 is a dictionary, depending on spectrometer frequency.
            if isinstance(getattr(cur_spin, mo_param), dict):
                set_r2 = params[mo_param]
                if mo_param not in ds.dx_params:
                    for key, val in set_r2.items():
                        # Update value to float
                        set_r2.update({ key : float(val) })
                        print("Setting param:%s to :%f"%(key, float(val)))
                    # Set it back
                    setattr(cur_spin, mo_param, set_r2)

            # For non dict values.
            else:
                if mo_param not in ds.dx_params:
                    before = getattr(cur_spin, mo_param)
                    setattr(cur_spin, mo_param, float(params[mo_param]))
                    after = getattr(cur_spin, mo_param)
                    print("Setting param:%s to :%f"%(mo_param, after))

        cur_model = model_analyse.replace(' ', '_')
        file_name_map = "%s_map%s" % (cur_model, cur_spin_id.replace('#', '_').replace(':', '_').replace('@', '_'))
        file_name_point = "%s_point%s" % (cur_model, cur_spin_id .replace('#', '_').replace(':', '_').replace('@', '_'))
        dx.map(params=ds.dx_params, map_type='Iso3D', spin_id=cur_spin_id, inc=ds.dx_inc, lower=ds.dx_lower_bounds, upper=ds.dx_upper_bounds, axis_incs=10, file_prefix=file_name_map, dir=ds.resdir, point=[ds.dx_set_val, ds.dx_clust_val], point_file=file_name_point, chi_surface=ds.dx_chi_surface)
        # vp_exec:  A flag specifying whether to execute the visual program automatically at start-up.
        #dx.execute(file_prefix=file_name, dir=ds.resdir, dx_exe='dx', vp_exec=True)

        if ds.print_res:
            print("For spin: '%s'"%cur_spin_id)
            print("Params for dx map is")
            print(ds.dx_params)
            print("Point creating dx map is")
            print(ds.dx_set_val)
            print("Minimises point in dx map is")
            print(ds.dx_clust_val)

# Print result again after dx map.
if ds.opendx:
    print_res(cur_spins=cur_spins, grid_params=ds.grid_results[i][3], min_params=ds.min_results[i][3], clust_params=ds.clust_results[i][3])