### python imports
import sys
import os
from math import cos, sin, sqrt, pi
from numpy import array, float64

### plotting facility.
import matplotlib.pyplot as plt

# Ordered dictionary
import collections

### relax modules
# Import some tools to loop over the spins.
from pipe_control.mol_res_spin import return_spin, spin_loop
# Import method to calculate the R1_rho offset data
from specific_analyses.relax_disp.disp_data import calc_rotating_frame_params, generate_r20_key, loop_exp_frq, loop_exp_frq_offset, loop_point, return_param_key_from_data, return_spin_lock_nu1
from specific_analyses.relax_disp import optimisation
from lib.nmr import frequency_to_Hz, frequency_to_ppm, frequency_to_rad_per_s

###############

# You have to provide a DPL94 results state file
res_folder = "resultsR1"
#res_folder = "results_clustering"
res_state = os.path.join(res_folder, "DPL94", "results")
spin_inte = ":44@N"
# Make a fake spin, from the spin of interest
fake_spin_inte = spin_inte.replace("N","X")

# Interpolate graph settings
#num_points=1000, extend=500.0
num_points=100
extend=5000.0

################
spin_inte_rep = spin_inte.replace('#', '_').replace(':', '_').replace('@', '_')

# Load the state
state.load(res_state, force=True)

# Get the dictionary key
for exp_type, frq in loop_exp_frq():
    r20_key = generate_r20_key(exp_type=exp_type, frq=frq)

# Show pipes
pipe.display()
pipe.current()

# Get the spin of interest and save it in cdp, to access it after execution of script.
cdp.myspin = return_spin(spin_inte)

# Copy the parameters from spin of interest to a fake spin to be modified.
spin.copy(spin_from=spin_inte, spin_to=fake_spin_inte)
# Returnspin
cdp.fakespin = return_spin(fake_spin_inte)

# Modify data
if spin_inte == ":52@N":
    # Set reference data
    cdp.fakespin.r2[r20_key] = 6.51945
    cdp.fakespin.kex = 13193.82986
    cdp.fakespin.kex_err = 2307.09152
    phi_ex_rad2_s2 = 93499.92172
    phi_ex_err_rad2_s2 = 33233.23039
    scaling_rad2_s2 = frequency_to_ppm(frq=1/(2*pi), B0=cdp.spectrometer_frq_list[0], isotope='15N')**2
    print scaling_rad2_s2

    cdp.fakespin.phi_ex = phi_ex_rad2_s2*scaling_rad2_s2
    cdp.fakespin.phi_ex_err = phi_ex_err_rad2_s2*scaling_rad2_s2

    print cdp.myspin.ri_data['R1'], cdp.myspin.ri_data_err['R1'], cdp.myspin.r2[r20_key], cdp.myspin.kex, cdp.myspin.phi_ex
    print cdp.fakespin.ri_data['R1'], cdp.fakespin.ri_data_err['R1'], cdp.fakespin.r2[r20_key], cdp.fakespin.kex, cdp.fakespin.phi_ex


# Calculate the offset data
theta_spin_dic, Domega_spin_dic, w_eff_spin_dic, dic_key_list = calc_rotating_frame_params(spin=cdp.myspin, spin_id=spin_inte, verbosity=0)
# Save the data in cdp to access it after execution of script.
cdp.myspin.theta_spin_dic = theta_spin_dic
cdp.myspin.w_eff_spin_dic = w_eff_spin_dic
cdp.myspin.dic_key_list = dic_key_list

############################
# First creacte back calculated R2eff data for interpolated plots.
############################


# Return the original structure for frq, offset
spin_lock_nu1 = return_spin_lock_nu1(ref_flag=False)

# Back calculate R2eff data for the set parameters.
cdp.fakespin.back_calc = optimisation.back_calc_r2eff(spin=cdp.fakespin, spin_id=fake_spin_inte, spin_lock_nu1=spin_lock_nu1)

# Prepare list to hold new data
spin_lock_nu1_new = []
# Loop over the structures to generate data
for ei in range(len(spin_lock_nu1)):
    # Add a new dimension.
    spin_lock_nu1_new.append([])

    # Then loop over the spectrometer frequencies.
    for mi in range(len(spin_lock_nu1[ei])):
        # Add a new dimension.
        spin_lock_nu1_new[ei].append([])

        # Finally the offsets.
        for oi in range(len(spin_lock_nu1[ei][mi])):
            # Add a new dimension.
            spin_lock_nu1_new[ei][mi].append([])

            # No data.
            if not len(spin_lock_nu1[ei][mi][oi]):
                continue

            # Interpolate (adding the extended amount to the end).
            for di in range(num_points):
                point = (di + 1) * (max(spin_lock_nu1[ei][mi][oi])+extend) / num_points
                spin_lock_nu1_new[ei][mi][oi].append(point)
            # Intersert field 0
            #spin_lock_nu1_new[ei][mi][oi][0] = 0.0

            # Convert to a numpy array.
            spin_lock_nu1_new[ei][mi][oi] = array(spin_lock_nu1_new[ei][mi][oi], float64)

# Then back calculate R2eff data for the interpolated points.
cdp.myspin.back_calc = optimisation.back_calc_r2eff(spin=cdp.myspin, spin_id=spin_inte, spin_lock_nu1=spin_lock_nu1_new)

# Calculate the offset data, interpolated
theta_spin_dic_inter, Domega_spin_dic_inter, w_eff_spin_dic_inter, dic_key_list_inter = calc_rotating_frame_params(spin=cdp.myspin, spin_id=spin_inte, fields = spin_lock_nu1_new, verbosity=0)

###### Store the data before plotting
# Create a dictionary to hold data
cdp.mydic = collections.OrderedDict()

# Loop over the data structures and save to dictionary
for exp_type, frq, offset, ei, mi, oi in loop_exp_frq_offset(return_indices=True):
    # This is not used, but could be used to get Rex.
    R1_rho_prime = cdp.myspin.r2[r20_key]
    #print R1_rho_prime

    # Get R1
    R1 = cdp.myspin.ri_data['R1']
    R1_err = cdp.myspin.ri_data_err['R1']

    # Add to dic
    if exp_type not in cdp.mydic:
        cdp.mydic[exp_type] = collections.OrderedDict()
    if frq not in cdp.mydic[exp_type]:
        cdp.mydic[exp_type][frq] = collections.OrderedDict()
    if offset not in cdp.mydic[exp_type][frq]:
        cdp.mydic[exp_type][frq][offset] = collections.OrderedDict()
        # X val
        cdp.mydic[exp_type][frq][offset]['point'] = []
        cdp.mydic[exp_type][frq][offset]['point_inter'] = []
        cdp.mydic[exp_type][frq][offset]['theta'] = []
        cdp.mydic[exp_type][frq][offset]['theta_inter'] = []
        cdp.mydic[exp_type][frq][offset]['w_eff'] = []
        cdp.mydic[exp_type][frq][offset]['w_eff_inter'] = []
        # Y val
        cdp.mydic[exp_type][frq][offset]['R1_rho'] = []
        cdp.mydic[exp_type][frq][offset]['R1_rho_err'] = []
        cdp.mydic[exp_type][frq][offset]['R1_rho_bc'] = []
        cdp.mydic[exp_type][frq][offset]['R1_rho_inter'] = []

        # Y val fake
        cdp.mydic[exp_type][frq][offset]['fake_R1_rho'] = []

        # Y2 val
        cdp.mydic[exp_type][frq][offset]['R1_rho_R2eff'] = []
        cdp.mydic[exp_type][frq][offset]['R1_rho_R2eff_err'] = []
        cdp.mydic[exp_type][frq][offset]['R1_rho_R2eff_bc'] = []
        cdp.mydic[exp_type][frq][offset]['R1_rho_R2eff_inter'] = []

    # Loop over the original dispersion points.
    for point, di in loop_point(exp_type=exp_type, frq=frq, offset=offset, return_indices=True):
        param_key = return_param_key_from_data(exp_type=exp_type, frq=frq, offset=offset, point=point)

        # X val
        cdp.mydic[exp_type][frq][offset]['point'].append(point)
        theta = theta_spin_dic[param_key]
        cdp.mydic[exp_type][frq][offset]['theta'].append(theta)
        w_eff = w_eff_spin_dic[param_key]
        cdp.mydic[exp_type][frq][offset]['w_eff'].append(w_eff)

        # Average resonance spin_lock_offset
        #print Domega_spin_dic[param_key]

        # Y val
        R1_rho = cdp.myspin.r2eff[param_key]
        cdp.mydic[exp_type][frq][offset]['R1_rho'].append(R1_rho)
        R1_rho_err = cdp.myspin.r2eff_err[param_key]
        cdp.mydic[exp_type][frq][offset]['R1_rho_err'].append(R1_rho_err)
        R1_rho_bc = cdp.myspin.r2eff_bc[param_key]
        cdp.mydic[exp_type][frq][offset]['R1_rho_bc'].append(R1_rho_bc)

        # Y val, fake
        fake_R1_rho = cdp.fakespin.back_calc[ei][0][mi][oi][di]
        cdp.mydic[exp_type][frq][offset]['fake_R1_rho'].append(fake_R1_rho)

        # Y2 val
        # Calc R1_rho_R2eff
        R1_rho_R2eff = (R1_rho - R1*cos(theta)*cos(theta)) / (sin(theta) * sin(theta))
        cdp.mydic[exp_type][frq][offset]['R1_rho_R2eff'].append(R1_rho_R2eff)

        R1_rho_R2eff_err = (R1_rho_err - R1_err*cos(theta)*cos(theta)) / (sin(theta) * sin(theta))
        cdp.mydic[exp_type][frq][offset]['R1_rho_R2eff_err'].append(R1_rho_R2eff_err)

        R1_rho_R2eff_bc = (R1_rho_bc - R1*cos(theta)*cos(theta)) / (sin(theta) * sin(theta))
        cdp.mydic[exp_type][frq][offset]['R1_rho_R2eff_bc'].append(R1_rho_R2eff_bc)

    ## Loop over the new dispersion points.
    for di in range(len(cdp.myspin.back_calc[ei][0][mi][oi])):
        point = spin_lock_nu1_new[ei][mi][oi][di]
        param_key = return_param_key_from_data(exp_type=exp_type, frq=frq, offset=offset, point=point)

        # X val
        cdp.mydic[exp_type][frq][offset]['point_inter'].append(point)
        theta = theta_spin_dic_inter[param_key]
        cdp.mydic[exp_type][frq][offset]['theta_inter'].append(theta)
        w_eff = w_eff_spin_dic_inter[param_key]
        cdp.mydic[exp_type][frq][offset]['w_eff_inter'].append(w_eff)

        # Y val
        R1_rho = cdp.myspin.back_calc[ei][0][mi][oi][di]
        cdp.mydic[exp_type][frq][offset]['R1_rho_inter'].append(R1_rho)

        # Y2 val
        # Calc R1_rho_R2eff
        R1_rho_R2eff = (R1_rho - R1*cos(theta)*cos(theta)) / (sin(theta) * sin(theta))
        cdp.mydic[exp_type][frq][offset]['R1_rho_R2eff_inter'].append(R1_rho_R2eff)

        #if oi == 0:
            #print exp_type, frq, offset, point, theta, w_eff

####### PLOT ####

## Define labels for plotting
filesave_R1_rho_R2eff = 'R1_rho_R2eff'
filesave_R1_rho = 'R1_rho'

# For writing math in matplotlib, see
# http://matplotlib.org/1.3.1/users/mathtext.html

ylabel_R1_rho = r'R$_{1\rho}$ [rad s$^{-1}$]'
ylabel_R1_rho_R2eff = r'R$_{1\rho}$, R$_{2,eff}$ [rad s$^{-1}$]'

xlabel_theta = 'Rotating frame tilt angle [rad]'
xlabel_w_eff = r'Effective field in rotating frame [rad s$^{-1}$]'
xlabel_lock = 'Spin-lock field strength [Hz]'

# Set image inches size
img_inch_x = 12
img_inch_y = img_inch_x / 1.6
legend_size = 6


# Plot values in dic
for exptype, frq_dic in cdp.mydic.items():
    for frq, offset_dic in frq_dic.items():
        for offset, val_dics in offset_dic.items():
            # General plot label
            graphlabel = "%3.1f_%3.3f_meas"%(frq/1E6, offset)
            graphlabel_bc = "%3.1f_%3.3f_bc"%(frq/1E6, offset)
            graphlabel_inter = "%3.1f_%3.3f_inter"%(frq/1E6, offset)
            graphlabel_fake = "%3.1f_%3.3f_fake"%(frq/1E6, offset)

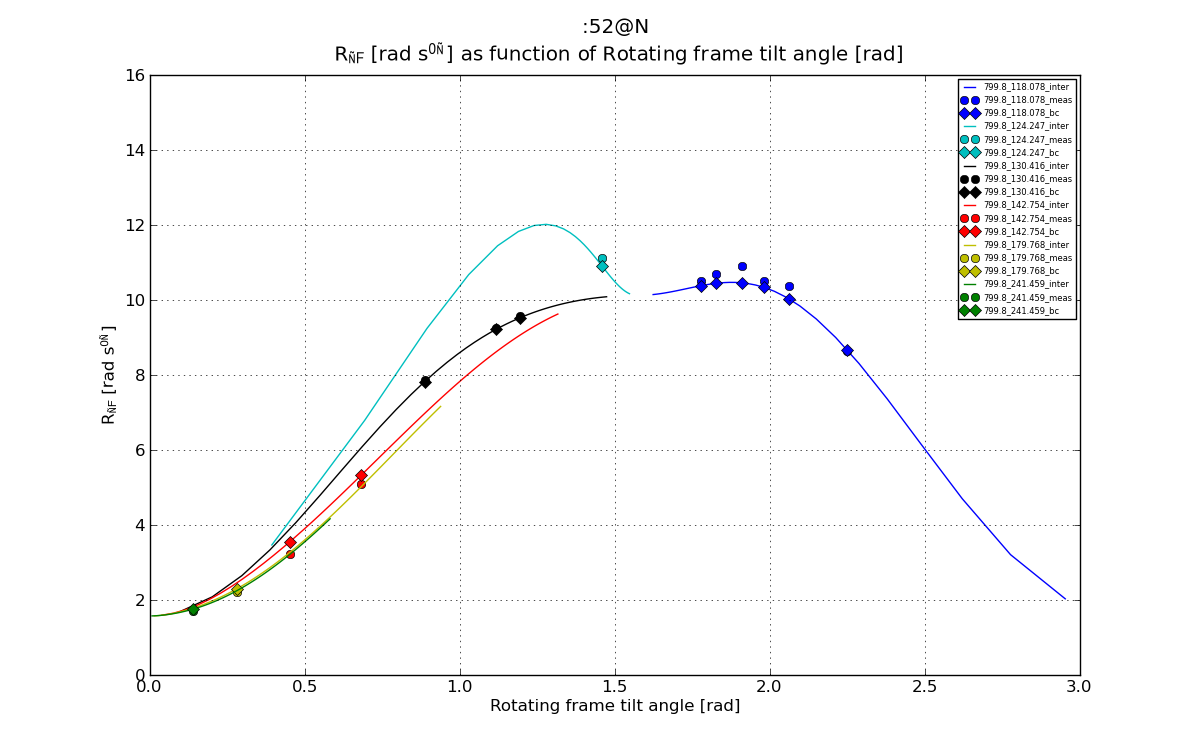
            # Plot 1: R1_rho as function of theta.
            plt.figure(1)
            line, = plt.plot(val_dics['theta_inter'], val_dics['R1_rho_inter'], '-', label=graphlabel_inter)
            plt.errorbar(val_dics['theta'], val_dics['R1_rho'], yerr=val_dics['R1_rho_err'], fmt='o', label=graphlabel, color=line.get_color())
            plt.plot(val_dics['theta'], val_dics['R1_rho_bc'], 'D', label=graphlabel_bc, color=line.get_color())

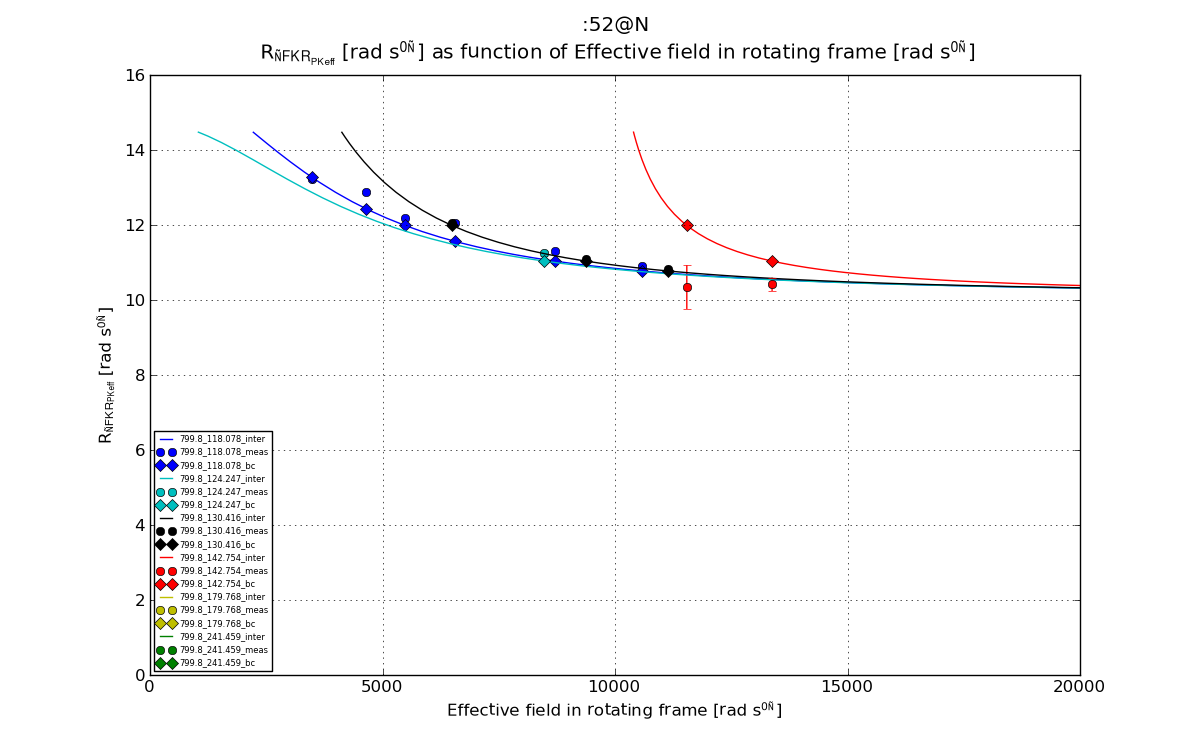
            # Plot 2: R1_rho_R2eff as function of w_eff
            plt.figure(2)
            w_eff2_inter = [x*x for x in val_dics['w_eff_inter']]
            w_eff2 = [x*x for x in val_dics['w_eff']]
            #line, = plt.plot(w_eff2_inter, val_dics['R1_rho_R2eff_inter'], '-', label=graphlabel_inter)
            #plt.errorbar(w_eff2, val_dics['R1_rho_R2eff'], yerr=val_dics['R1_rho_R2eff_err'], fmt='o', label=graphlabel, color=line.get_color())
            #plt.plot(w_eff2, val_dics['R1_rho_R2eff_bc'], 'D', label=graphlabel_bc, color=line.get_color())
            line, = plt.plot(val_dics['w_eff_inter'], val_dics['R1_rho_R2eff_inter'], '-', label=graphlabel_inter)
            plt.errorbar(val_dics['w_eff'], val_dics['R1_rho_R2eff'], yerr=val_dics['R1_rho_R2eff_err'], fmt='o', label=graphlabel, color=line.get_color())
            plt.plot(val_dics['w_eff'], val_dics['R1_rho_R2eff_bc'], 'D', label=graphlabel_bc, color=line.get_color())

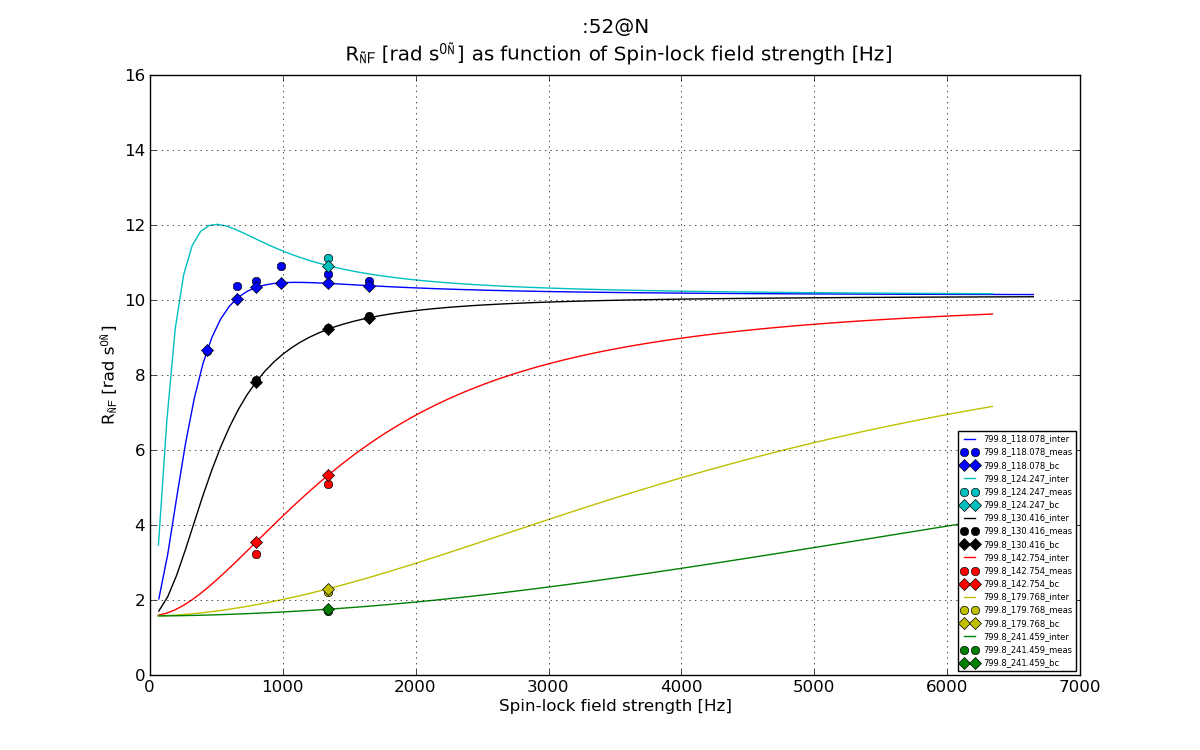
            # Plot 3: R1_rho as function of as function of disp_point, the Spin-lock field strength
            plt.figure(3)
            line, = plt.plot(val_dics['point_inter'], val_dics['R1_rho_inter'], '-', label=graphlabel_inter)
            plt.errorbar(val_dics['point'], val_dics['R1_rho'], yerr=val_dics['R1_rho_err'], fmt='o', label=graphlabel, color=line.get_color())
            plt.plot(val_dics['point'], val_dics['R1_rho_bc'], 'D', label=graphlabel_bc, color=line.get_color())
            plt.plot(val_dics['point'], val_dics['fake_R1_rho'], '*', label=graphlabel_fake, color=line.get_color())


# Define settings for each graph
# Plot 1: R1_rho as function of theta.
fig1 = plt.figure(1)
plt.xlabel(xlabel_theta)
plt.ylabel(ylabel_R1_rho)
plt.legend(loc='best', prop={'size':legend_size})
plt.grid(True)
#plt.ylim([0,16])
plt.title("%s \n %s as function of %s"%(spin_inte, ylabel_R1_rho, xlabel_theta))
fig1.set_size_inches(img_inch_x, img_inch_y)
plt.savefig("matplotlib_%s_%s_theta_sep.png"%(spin_inte_rep, filesave_R1_rho) )

## Plot 2: R1_rho_R2eff as function of w_eff
fig2 = plt.figure(2)
plt.xlabel(xlabel_w_eff)
plt.ylabel(ylabel_R1_rho_R2eff)
plt.legend(loc='best', prop={'size':legend_size})
plt.grid(True)
#plt.ylim([0,16])
#plt.xlim([0,20000*20000])
plt.xlim([0,20000])
plt.title("%s \n %s as function of %s"%(spin_inte, ylabel_R1_rho_R2eff, xlabel_w_eff))
fig2.set_size_inches(img_inch_x, img_inch_y)
plt.savefig("matplotlib_%s_%s_w_eff.png"%(spin_inte_rep, filesave_R1_rho_R2eff) )

## Plot 3: R1_rho as function of as function of disp_point, the Spin-lock field strength
fig3 = plt.figure(3)
plt.xlabel(xlabel_lock)
plt.ylabel(ylabel_R1_rho)
plt.legend(loc='best', prop={'size':legend_size})
plt.grid(True)
#plt.ylim([0,16])
plt.title("%s \n %s as function of %s"%(spin_inte, ylabel_R1_rho, xlabel_lock))
fig3.set_size_inches(img_inch_x, img_inch_y)
plt.savefig("matplotlib_%s_%s_disp.png"%(spin_inte_rep, filesave_R1_rho_R2eff) )

plt.show()


